
07 Jun May 2026 Housing Market Update: York & Lancaster Counties
May continued to show just how competitive things are across South Central Pennsylvania. Both York and Lancaster Counties are firmly in seller’s market territory, with inventory running well below where it was a year ago and homes going under contract in less than a week. That said, both markets are behaving a little differently from each other, and understanding those nuances really does matter whether you’re looking to buy, sell, or both. Here’s what the numbers are telling us this month.
At a Glance: May 2026
| Metric | York County | Lancaster County |
|---|---|---|
| Months of Inventory | 1.39 | 1.32 |
| Sold to List Price % | 100.5% | 102.9% |
| Median Days on Market | 5 days | 4 days |
| Median Sold Price | $299,900 | $368,000 |
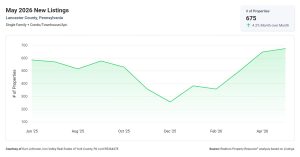
| New Listings (count) | 769 | 675 |
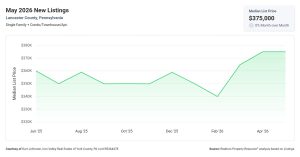
| New Listings Median List Price | $314,000 | $375,000 |
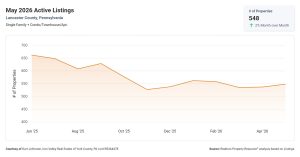
| Active Listings (count) | 664 | 548 |
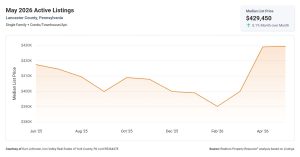
| Active Listings Median List Price | $374,900 | $429,450 |
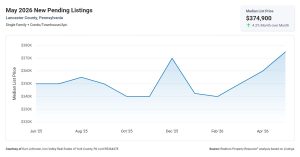
| New Pending Median List Price | $305,000 | $374,900 |
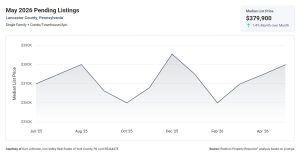
| Pending (EOM) Median List Price | $329,900 | $379,900 |
| Median Est. Property Value | $319,170 | $403,000 |
Data provided by Realtors Property Resource (RPR). Single Family plus Condo/Townhouse/Apt.
York County
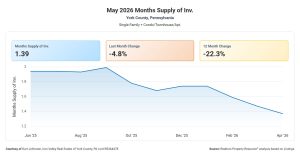
Months of Inventory
York County had 1.39 months of inventory in May, down 4.79% from April and down 22.3% from this time last year. When inventory is this tight, buyers have fewer choices and sellers hold more leverage.
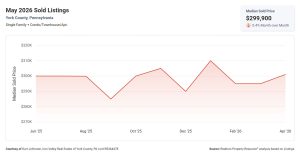
Median Sold Price
The median sold price came in at $299,900 in May, essentially unchanged from April (down just 0.37%). York County pricing has been remarkably stable at this level, reflecting steady demand without the sharp swings seen in some other markets.
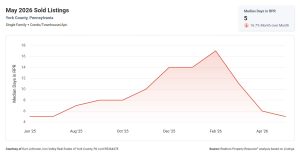
Median Days on Market
Homes in York County spent a median of just 5 days on market before going under contract, a 16.67% drop from April. If you’re a buyer, that pace means you can’t afford to hesitate. If you’re a seller, it means correctly priced homes are finding buyers fast.
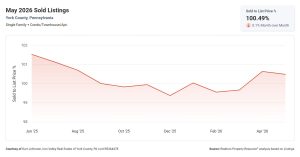
Sold to List Price %
York County’s sold to list price ratio was 100.5% in May, down just slightly from last month but still above asking. Sellers are holding strong on price, and buyers need to come in with competitive, serious offers to win.
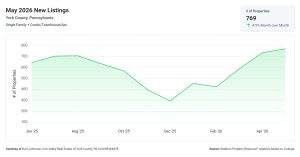
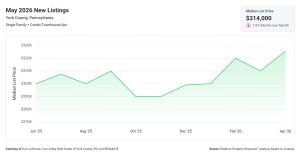
New Listings
769 new listings entered the York County market in May with a median list price of $314,000, which was down 1.9% from April. More supply is always welcome for buyers, but new listings are still being absorbed quickly.
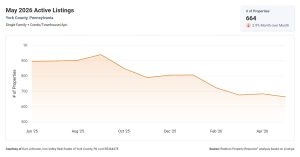
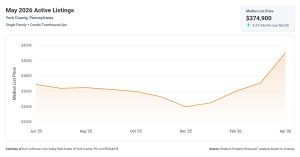
Active Listings
Active listings at month’s end stood at 664, with a median list price of $374,900 — up 4.2% from April. The gap between that active listing price and the $299,900 median sold price reflects a mix of price points still working through the market.
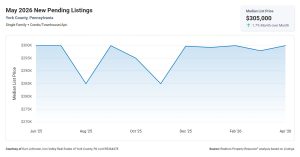
New Pending Listings
The median list price on new pending listings was $305,000, up 1.7% month over month. This reflects which price ranges are attracting the most buyer activity — entry and mid-level homes are moving quickly.
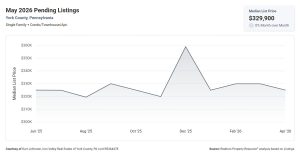
Pending Listings (End of Month)
Pending listings at month’s end carried a median list price of $329,900, flat from April. This snapshot of contracts waiting to close shows a healthy pipeline of activity heading into June.
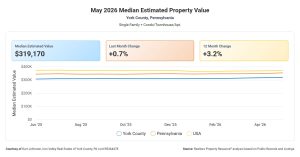
Median Estimated Property Value
RPR’s median estimated property value for York County is $319,170, up 0.7% from last month and up 3.2% over the past year. Steady, consistent appreciation — good news for homeowners watching their equity grow.
Lancaster County
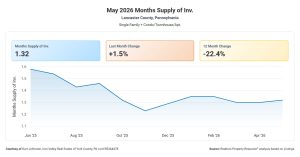
Months of Inventory
Lancaster County’s months of inventory was 1.32 in May, ticking up 1.54% from April but still 22.4% below where it stood a year ago. The long-term direction is clear: Lancaster has been steadily losing inventory for twelve months, and that’s keeping competition intense.
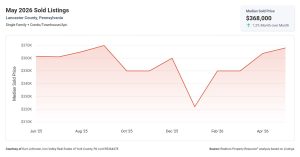
Median Sold Price
The median sold price in Lancaster County reached $368,000 in May, up 1.18% from April. Lancaster continues to command a notable premium over York County, and that gap has been consistent — reflecting Lancaster’s sustained demand and price appreciation.
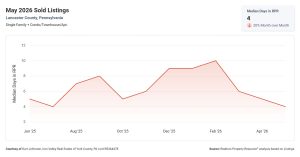
Median Days on Market
Lancaster homes spent a median of just 4 days on market — down 20% from April. That is an extraordinarily fast pace. For sellers, it means the market is responding quickly to well-presented homes. For buyers, having a pre-approval letter in hand before you start touring isn’t optional — it’s essential.
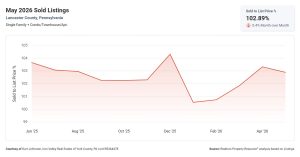
Sold to List Price %
Lancaster County’s sold to list price percentage was 102.9% in May, down just slightly from the prior month but still well above asking. On a $368,000 median sale, that represents buyers bringing approximately $10,700 above list to the table on average.
New Listings
675 new listings came to market in Lancaster County in May, with a median list price of $375,000 — unchanged from April. Supply is entering at a healthy clip, but demand is keeping pace.
Active Listings
Active listings at month’s end were 548, with a median list price of $429,450, up just 0.1% from April. The active inventory median is considerably higher than the median sold price, which reflects the mix of higher-priced homes still on the market.
New Pending Listings
New pending listings carried a median list price of $374,900 in May, up 4.2% from April — the largest month-over-month move in any Lancaster metric this month. Buyers are actively competing for homes in this price range.
Pending Listings (End of Month)
End-of-month pending listings had a median list price of $379,900, up 1.4% from April. This healthy backlog of contracts confirms Lancaster’s pipeline of activity heading into summer.
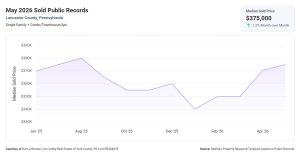
Sold Public Records
The sold public records median in Lancaster County was $375,000 for May, up 1.2% month over month. This broader view of all sales — including those not listed in MLS — confirms the same upward pricing story.
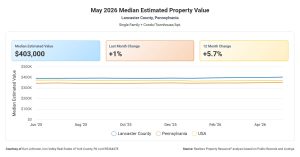
Median Estimated Property Value
Lancaster County’s median estimated property value is $403,000, up 1% from last month and up 5.7% over the past twelve months. For homeowners who purchased even a year or two ago, that equity growth is significant.
What This Tells Us
For Buyers
Both York and Lancaster Counties are moving fast — 5 days and 4 days to contract, respectively — and buyers are regularly paying at or above asking price. That doesn’t mean you can’t compete. It means you need to be prepared. Get your financing squared away before you start shopping. Know your budget ceiling. Work with an agent who can move quickly when the right home comes up. York County’s $299,900 median sold price makes it an accessible entry point relative to Lancaster, and it has the same tight-inventory dynamics. In Lancaster, the price point is higher and the competition is fierce, but well-qualified buyers are still succeeding every day.
For Sellers
You are sitting in a strong position in both counties. Inventory is historically low, demand is consistent, and homes priced correctly are going under contract in less than a week. Lancaster sellers are seeing sold-to-list ratios nearly three percent above asking, while York sellers are landing right at list. That said, “strong market” is not the same as “any price will work.” Overpriced homes still sit. The sellers winning right now are the ones who price strategically, prepare their homes thoughtfully, and partner with agents who know how to manage competing offers. If you’ve been thinking about listing, now is a very good time to have that conversation.
One Thing to Watch
The gap in median sold price between York County ($299,900) and Lancaster County ($368,000) is roughly $68,000 — and it has remained remarkably consistent. What’s worth watching is whether that gap narrows as York County appreciation (up 3.2% year over year) begins to close ground on Lancaster (up 5.7%). York’s active listing median list price already jumped 4.2% in May, which may signal sellers beginning to test higher price points. If buyers follow, York County’s pricing story could look meaningfully different by late summer.
No Comments