
07 Apr York and Lancaster Counties Housing Market Update | March 2026
March 2026 brought more of what we’ve been seeing across the Susquehanna Valley: tight inventory, fast movement, and buyers competing hard for well-priced homes. York County finished the month at 1.43 months of supply and Lancaster came in even tighter at 1.32 — both well below what you’d see in a balanced market. Homes in Lancaster went under contract in a median of 6 days, while York came in at 11, and in both cases those numbers got faster compared to the month before. If you’re watching these markets right now, whether as a buyer or a seller, March was not a month that told you to slow down.
At a Glance | March 2026
| Metric | York County | Lancaster County |
| Months of Inventory | 1.43 (-7.74% MoM) | 1.32 (-2.22% MoM) |
| Sold to List Price | 99.5% (-0.06% MoM) | 102% (+1.24% MoM) |
| Median Days on Market | 11 days (-35.29% MoM) | 6 days (-33.33% MoM) |
| Median Sold Price | $295,000 (flat MoM) | $349,650 (-0.1% MoM) |
| Median Est. Value | $314,340 (+1.1% MoM) | $397,410 (+0.5% MoM) |
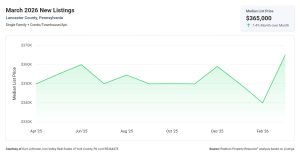
| New Listings Median | $315,000 (-3% MoM) | $365,000 (+7.4% MoM) |
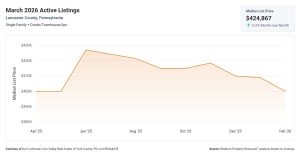
| Active Listings Median | $379,945 (+4.7% MoM) | $424,867 (+6.2% MoM) |
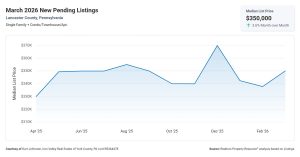
| New Pending Median | $298,450 (-0.2% MoM) | $350,000 (+3.6% MoM) |
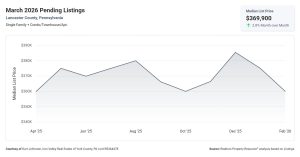
| Pending Listings Median | $325,300 (-1.4% MoM) | $369,900 (+2.8% MoM) |
| Sold Public Records | $250,000 (-3.8% MoM) | $340,000 (-1.8% MoM) |
Data provided by Realtors Property Resource (RPR). Single Family plus Condo/Townhouse/Apt.
York County, Pennsylvania | March 2026
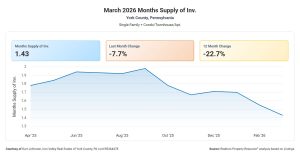
Months of Inventory
York County’s inventory level dropped to 1.43 months in March, down 7.74% from February and down 22.7% year over year. In a market where 5 to 6 months represents balance, 1.43 keeps York County firmly in seller’s market territory.
For sellers, limited supply means less competition and continued leverage on price. For buyers, this number is a reminder to come prepared — homes are moving before most people even have a chance to think about it.
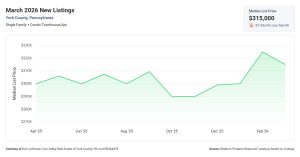
New Listings
New listings that hit the York County market in March carried a median list price of $315,000, down 3% from February.
For buyers, fresh inventory is entering at a slightly lower price point than what has been sitting active, though overall supply remains tight. For sellers, new competition entering at a lower price reinforces the value of well-positioned listings already active.
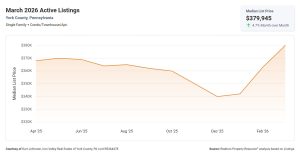
Active Listings
Active listings at the end of March showed a median list price of $379,945, up 4.7% from February. The homes still available tend to be priced higher, which reflects the pattern of lower-priced inventory getting absorbed fastest.
For buyers, the gap between what’s available and what’s going under contract is a useful signal about where demand is strongest. For sellers priced in the mid-range, you’re right in the sweet spot.
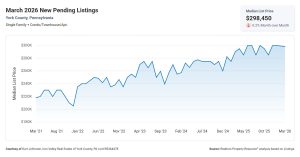
New Pending Listings
Homes that went under contract in March carried a median list price of $298,450, essentially flat from February at -0.2%. The market is consistently absorbing homes right around the $300,000 range.
For buyers targeting that price point, competition is real and consistent. For sellers near that range, properties are being absorbed reliably month after month.
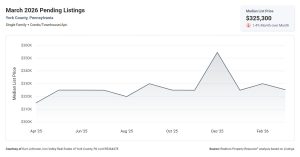
Pending Listings
End-of-month pending listings in York County carried a median list price of $325,300, down 1.4% from February — a healthy pipeline of homes working toward closing.
For both buyers and sellers, a steady pending pipeline means transactions are completing, which keeps the broader market moving forward with confidence.
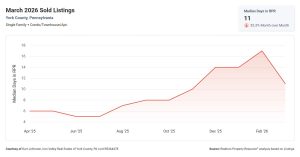
Median Days on Market
Homes in York County spent a median of 11 days on the market in March, down 35.29% from February. The pace of absorption is accelerating, not slowing down.
For sellers, faster absorption is a strong sign of demand. For buyers, 11 days means the decision window is tight — a slow approach is likely to result in missed opportunities.
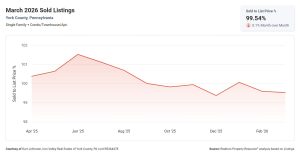
Sold to List Price
York County homes sold at 99.5% of list price in March, down just 0.06% from February — essentially flat and essentially at asking.
For buyers, pricing an offer at or near list is generally the floor in this market, not a ceiling. For sellers, well-priced homes are consistently getting what they ask for.
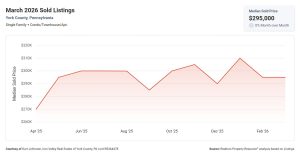
Median Sold Price
The median sold price in York County was $295,000 in March, flat from February at 0% change. Prices are holding steady while the market moves quickly — a healthy combination.
For sellers, price stability alongside fast absorption means the market is active and genuine, not inflated. For buyers, you’re not seeing prices spike erratically, but you are competing for what’s available.
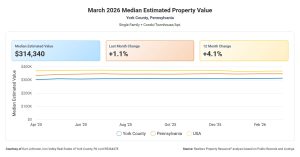
Median Estimated Property Value
The median estimated property value in York County came in at $314,340 in March, up 1.1% from last month and up 4.1% over the past year.
For homeowners, that year-over-year appreciation is steady, consistent equity building. For buyers considering York County as a long-term investment, the appreciation trajectory has been reliable.
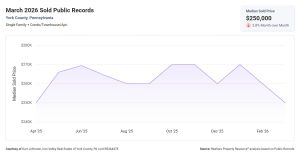
Sold Public Records
Public records data for York County shows a median sold price of $250,000 in March, down 3.8% from February. This figure captures all transactions including off-market and non-MLS sales, so it typically runs below the MLS sold median and reflects a broader slice of activity.
For buyers and sellers alike, public records offer a complete market view that includes transactions never appearing on traditional listing platforms.
Lancaster County, Pennsylvania | March 2026
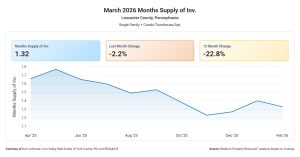
Months of Inventory
Lancaster County’s inventory level came in at 1.32 months in March, down 2.22% from February and down 22.8% year over year — the tighter of the two markets this month.
For sellers, Lancaster’s sub-1.5-month supply is about as favorable a position as you can be in. For buyers, the pool of available homes is small and competition is intense.
New Listings
New listings in Lancaster County came to market in March with a median list price of $365,000, up 7.4% from February. Sellers entering the Lancaster market in March were pricing with confidence.
For buyers, fresh inventory is coming in at meaningfully higher price points than the previous month — financing locked in and moving quickly is essential. For sellers, new listings pricing higher reflects healthy confidence in where demand is sitting.
Active Listings
Active listings at the end of March in Lancaster carried a median list price of $424,867, up 6.2% from February. These are the homes still on the market at month’s end, and their higher price point reflects both appreciation and the continued fast absorption of more affordable inventory.
For buyers, the homes remaining available tend to sit at the higher end of the price range. For sellers in that upper price band, demand is still healthy.
New Pending Listings
Homes that went under contract in Lancaster County in March had a median list price of $350,000, up 3.6% from February. The market is absorbing homes right around that price point with regularity.
For buyers near $350,000 in Lancaster, you’re squarely in the most active zone of absorption. For sellers priced there, the data says you’re well positioned.
Pending Listings
End-of-month pending listings in Lancaster showed a median list price of $369,900, up 2.8% from February — a pipeline reflecting both volume and upward price movement in the contracts working toward close.
A rising pending median signals that the contracts being executed are at progressively stronger price points, which bodes well for the broader market.
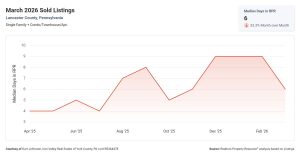
Median Days on Market
Lancaster County homes spent a median of just 6 days on the market in March, down 33.33% from February. Six days is an extremely fast absorption pace, and it got faster month over month.
For sellers, this is about as strong a demand signal as exists. For buyers, 6 days is not a window for deliberation — it’s a window for preparation and decisiveness.
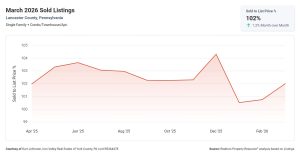
Sold to List Price
Homes in Lancaster County sold at 102% of list price in March, up 1.24% from February. On average, buyers in Lancaster paid above asking.
For buyers, list price is often the starting point of competition, not the ceiling. For sellers, 102% is an outstanding result and a reflection of genuine demand.
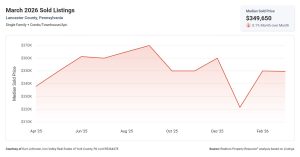
Median Sold Price
The median sold price in Lancaster County was $349,650 in March, essentially flat from February at -0.1%. Stable sold prices with rapid absorption and above-asking results point to a healthy, demand-driven market.
For sellers, price stability paired with above-asking sales means the market is rewarding well-priced listings. For buyers, prices aren’t spiking unpredictably, but the competition for homes is very real.
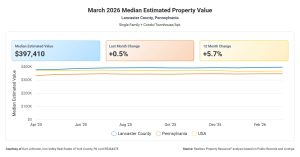
Median Estimated Property Value
The median estimated property value in Lancaster County came in at $397,410 in March, up 0.5% from February and up 5.7% over the past year.
For current homeowners in Lancaster, that 5.7% year-over-year appreciation represents meaningful equity growth. For buyers, the appreciation trajectory in Lancaster has been strong and consistent over time.
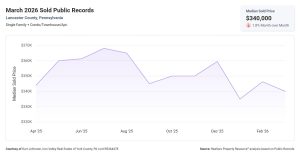
Sold Public Records
Public records data for Lancaster County shows a median sold price of $340,000 in March, down 1.8% from February. This includes all qualifying transactions whether listed on the MLS or not, providing a complete view of the market beyond what was publicly listed.
The public records median confirms that the broader Lancaster market, including off-market transactions, is still performing solidly above $300,000.
What This Tells Us
For Buyers
If you’re actively searching in York or Lancaster County right now, March 2026 is telling you to come ready. Both markets are absorbing homes fast — York at 11 days and Lancaster at 6 — and neither market is producing surplus inventory. The homes going under contract in York are landing right around $298,000, and in Lancaster around $350,000. Being pre-approved, knowing your priorities, and being willing to move decisively when the right home appears isn’t optional strategy in this market. It’s the baseline.
For Sellers
If you’re thinking about listing in York or Lancaster County, the data from March is encouraging. Inventory is historically low in both markets, days on market dropped month over month in both counties, and Lancaster sellers are averaging above asking while York sellers are getting essentially full price. That said, pricing still matters. The homes being absorbed quickly are well priced for their condition and location. Price it right from the start and the market will respond.
One Thing to Watch
The gap between Lancaster and York County on sold-to-list price ratio is worth keeping an eye on. Lancaster is at 102%, meaning buyers there are paying above asking. York is at 99.5%, essentially at asking. That spread tells you Lancaster is absorbing demand at a slightly more intense pace right now, even though both counties are running lean on inventory. If Lancaster’s ratio continues to climb while York holds steady near asking, it may signal that buyer demand pressure is tilting east of the Susquehanna in the coming months — which could ripple into pricing dynamics on the York side as buyers who get outbid in Lancaster look west.
No Comments